Chart Templates
Q can make use of chart templates when exporting tables to Microsoft Office. You can save your own custom templates for Q to use, meaning that you do not have to set up the formatting of your charts for each export.
How to create a template using PowerPoint, Word or Excel 2007/2010/2013/2016/Office 365
- Click on a chart that you wish to use as a template in PowerPoint, Word or Excel.
- Save the chart as a template using PowerPoint (or Excel or Word):
- In Office 2013 or a later version, a chart template is saved by right-clicking on your chart and selecting Save As Template
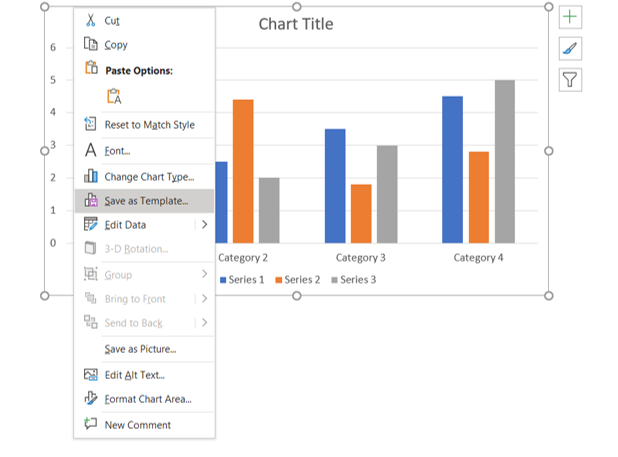
- In Office 2010 and Office 2007, a chart template is saved by selecting your chart, clicking on the Design tab under Chart Tools at the top of your window, and then clicking the Save As Template button in the top-left of the window.
- In Office 2013 or a later version, a chart template is saved by right-clicking on your chart and selecting Save As Template

Process for creating a good template
While the process described above will create a template, the following more detailed steps will generally result in a better quality template:
- Decide what type of chart you want to create (e.g., a pie chart, stacked bar chart, area chart, etc.).
- In Q, create a large table that is appropriate for the type of chart. The table should be the largest sized chart that you will ever require. For example, for a pie chart perhaps it will have 20 categories, whereas for a stacked bar chart, perhaps 20 categories and 10 series. If you create a template using a table that is too small, Office will revert to defaults for any extra data. (For example, if you create a pie chart template using only five categories, then when this template is used on data with more than five categories, the categories will be formatted as per PowerPoint's defaults, which will mean that somebody will need to fix the chart manually.)
- Export the table as a chart, using the To PowerPoint as Excel Chart format when exporting to PowerPoint from Q.
- Customize the chart as desired.
- Appropriate customizations: chart colors, fonts, and backgrounds for series, legends, and axes.
- Inappropriate customizations (i.e., customizations that will either not be saved, or, will have unforeseen negative consequences): individual data labels, axis minima and maxima, adding text, moving things (e.g., legend), resizing things by dragging and dropping.
- In Q, duplicate the table and export it again, using the template (see below) and check that it has exported appropriately. Note that there can be a few things that are a bit fiddly. In particular:
Microsoft Excel for Office 2003 and earlier
In Excel, create charts either from scratch or by exporting from Q. Ensure that the charts are created as new sheets in the Excel file, rather than as objects in sheets with other information in them. Customize these as desired. Save the Excel file as a normal Excel file (with extension .xls). In Q, go to the Edit menu and select User Options. Select Microsoft Excel (Office 2003 and earlier) in the Template system menu, and then browse for your newly created Excel file in the Excel chart template box. Browsing ensures that the full path name of this file is included in the Excel chart template box.
Where templates are saved
The settings for using templates in Q can be found in Edit > User Options > Export Chart Defaults.
Applying Templates
To apply a template during your export you should:
- Begin your export by clicking one of the Office export buttons.
- Select the export option with Excel Chart in the Format drop-down menu.
- Locate your template in the Chart drop-down menu. All custom templates appear at the top of the list, so you may need to scroll up to see it, as new templates get added above the default templates.
- Click OK to export your chart.
Setting defaults
Default chart types can be set for different types of tables using Edit > User Options > Export Chart Defaults.