Facebook API
Overview of the Facebook API
This page explains how to use R with Facebook API's to extract information and insights about Facebook Pages, including Page views, user posts, reach, engagement, reactions, and more. The data obtained using the Facebook API can be used to create analysis and charting to track your social activity as well as mining content from public pages.
The basic process required to access and utilize the Facebook API is:
- Create an app for your Facebook Page (this is needed to obtain an authentication token which will be used in all API calls).
- Generate a non-expiring the authentication token.
- Create an R output to call Facebook APIs which will generate the dataframes used in the analysis.
- Create charts and analysis in Q.
App Setup and Configuration
A Facebook app must be setup to generate an APP_ID and APP_SECRET which are necessary for the creating of a non-expiring authentication token which is used in all API calls. You must register for the Facebook Developers Network before you can setup an app.
One registered on the Facebook Developer Network, setup the Facebook Page app as follows:
- Go to https://developers.facebook.com/apps/ and select "Add a New App".
- Click "Skip and Create App ID"
- Enter a Display Name, Contact Email and select "Apps for Pages" as the Category.
- Click on "Create App ID"
- The App ID and App Secret will be displayed on the App Dashboard.
Authentication token
An authentication token is required for all API calls. There are two types of tokens which can be generated for the Facebook API calls: a dynamic OAuth token or a non-expiring token. The non-expiring token can be used for all Facebook API calls
OAuth authentication token
The OAuth token can be generated dynamically by creating an R script which passes the App ID and App Secret to the Facebook OAuth API.
baseurl <- ('https://graph.facebook.com/oauth/access_token')
clientid <- ('[YOUR APP ID]')
clientsecret <- ('[YOUR APP SECRET]')

token <- GET(paste(baseurl,'?client_id=',clientid,'&client_secret=',clientsecret,'&grant_type=client_credentials',sep=""))
token = gsub("access_token=", "", content(token))
The OAuth token can be used for most Facebook API's but will not work with the any of the getInsights API's which are used to retrieve insight data from an owned Facebook Page.
Non-expiring authentication token
To generate a non-expiring token, a short-term expiring token must first be generated and exchanged for a long-term expiring token. The long-term token is then exchanged for a non-expiring token.
- Go to the Facebook Graph API Explorer.
- Select your app from the Application drop-down list.
- Select Get User Access Token from the token drop-down list.
- From the Select Permissions dialogue box, select all of the permission checkboxes.
- Click "Get Access Token" button. The token will be generated and displayed in the "Access Token" field.
- Copy the access token and paste it into the following page to verify the token expiration: https://developers.facebook.com/tools/debug/accesstoken (the token should expire within an hour).
- Go to the following URL to exchange the token for a long-lived token. Enter your App ID, App Secret and the short-term token into the URL where indicated: https://graph.facebook.com/oauth/access_token?client_id=YOURAPPID&client_secret=YOURAPPSECRET&grant_type=fb_exchange_token&fb_exchange_token=YOURSHORTTERMTOKEN. The webpage page will return a long-lived token in the browser. Paste the token into the debugger to confirm the token expiration (which should now be two months). Be sure to remove the leading and trailing metadata from the returned token.
- Return to the Facebook Graph API Explorer and enter the long-lived (two month) token into the Access Token box.
- In the GET box, enter me?fields=id,name.
- From the Get Token drop-down select User Access Token.
- Click the Submit button.
- The API will return your user ID and name. In the GET box, enter [YOURUSERID]/accounts and click the Submit button.
- This will return an non-expiring token. Paste the token into the debugger to verify the expiration.
- Store the non-expiring token in a variable in R which will be used in all API calls.
authtoken <- '[YOUR NON-EXPIRING TOKEN]'
Required R Packages
The RFacebook package must first be installed and can be acquired from the CRAN site or from GitHub.
install.packages("Rfacebook") # from CRAN
install_github("pablobarbera/Rfacebook/Rfacebook") # from GitHub
Once RFacebook has been installed, the following R packages must be loaded at the beginning of the R Script to use the Rfacebook API's.
require("Rfacebook")
require("httr")
library(devtools)
Facebook API Calls
Below is a sampling of some the commonly used Facebook APIs. For a complete list of available API metrics and modifiers, reference the Facebook API Documentation.
Get Insights
The getInsights API is passed with a specific metric such as page views, page fans, page reach, post impressions, etc. A complete list of metrics which can be used with the getInsights API are locate on the Facebook Developer Network API Reference for Insights.
Note: By default, the getInsights API returns all metrics in multiples of 3 if no period parameters are specified (except for those metrics which take a "lifetime" period parameter.
The following examples illustrate two common uses of the getInsights API.
Get Insights - Page Fans
The total daily number of page "Likes" for an owned Page.
page_fans <- getInsights([PAGEID], authtoken, metric='page_fans', period='lifetime', parms='&since=2016-08-01&until=2016-08-08')
Returns a dataframe with aggregate number of page likes each day for the period specified.
Get Insights - Page Views
The total number of daily Page views for an owned Page.
page_views <- getInsights([PAGEID], authtoken, metric='page_views_logged_in_unique', period='day', parms='&since=2016-08-01&until=2016-08-08')
Returns a dataframe with the daily number of Page views over the past 7 days.
Page Posts
Listing of all posts on a page including post details and statistics (type, date, likes, comments, etc.) for any owned or public Page.
page <- getPage('45084588507', authtoken, n = 5)
Returns a dataframe with the 5 most recent posts from a public Page along with likes, comments and shares counts for each post:
Post Details
Information about a Facebook post, including list of comments and likes, from any owned or public Page.
post <- getPost('45084588507_10155347644783508', authtoken, comments = TRUE, likes = TRUE, n.likes = 5, n.comments = 5)
Returns a list with data frames of the 5 most recent likes and comments for a specific Post ID. Use $ to access the data frames from the returned list.
post$post
post$likes
post$comments
Using Facebook API with Q
The R Facebook API's can be used in Q to create data frames from which charts, tables and other analyses can be created.
Creating Data Frames
To create an R Output in Q, select Create > R Output. Enter the following R code to generate a data frame using the getPage API on a public page ID. Note that the token is stored in a separate R Output so that it can be referenced in all other R Outputs.
require("Rfacebook")
require("httr")
library(devtools)

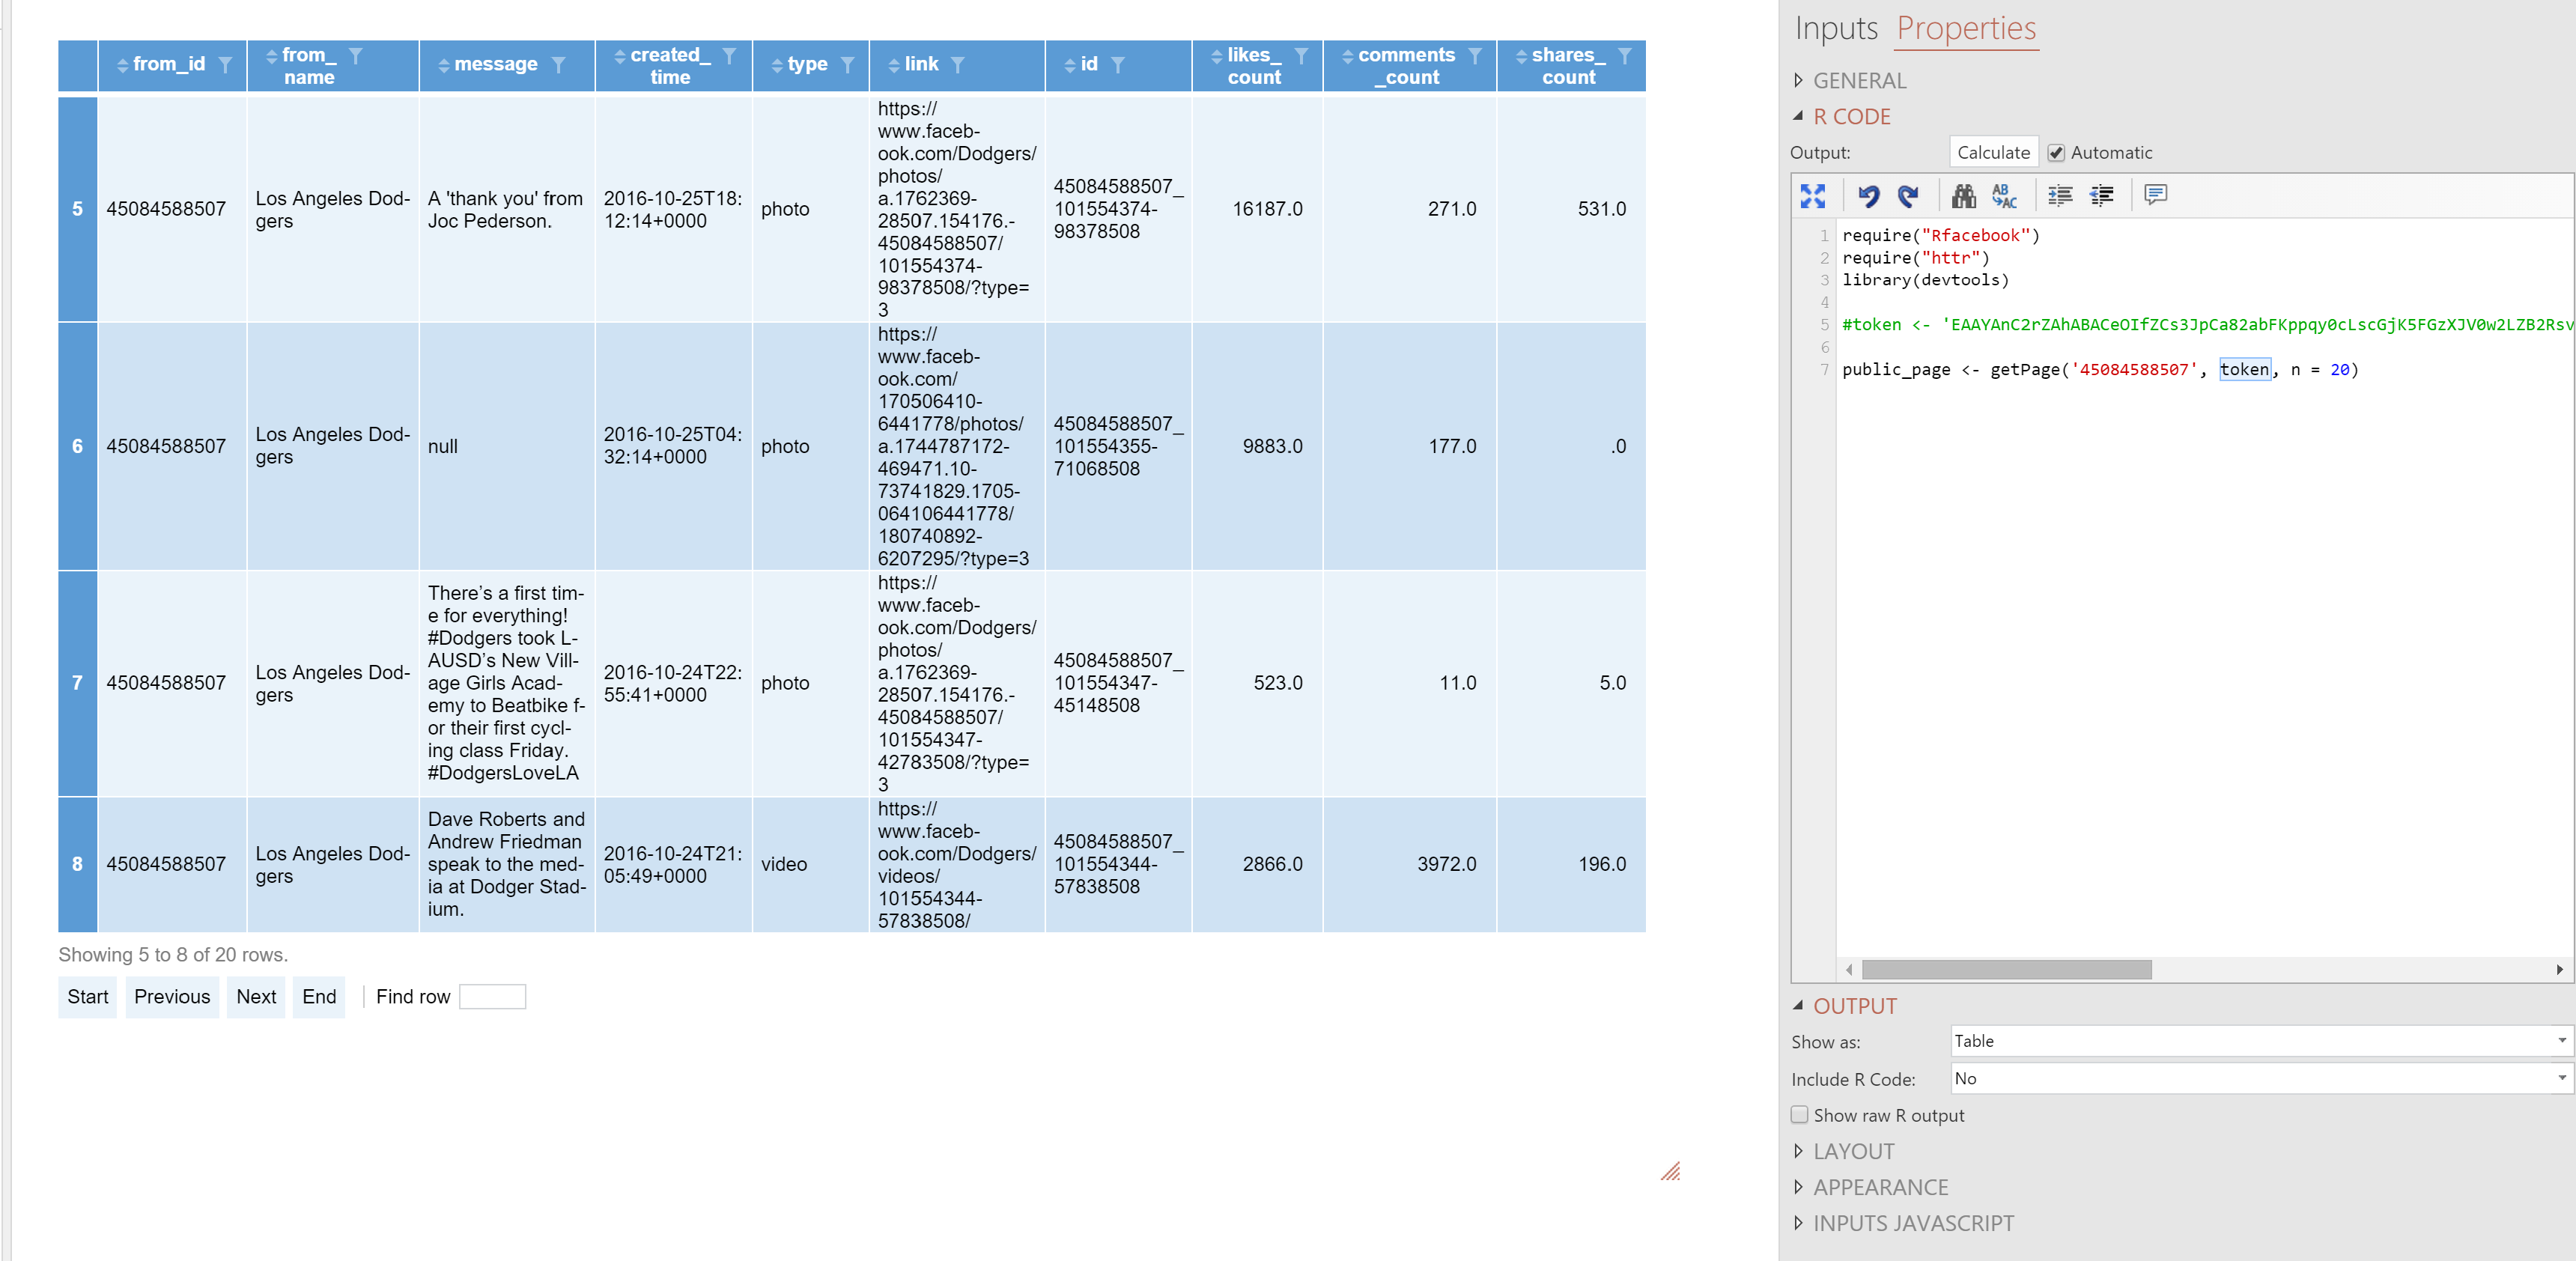
public_page <- getPage('45084588507', token, n = 20)
The following data frame will be generated in Q:
Data Manipulation
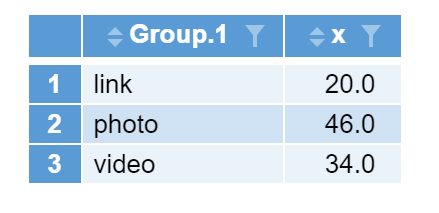
The data can be easily manipulated in R to allow for charting and analysis. The following R code aggregates the number of posts by post type:
aggdata.1 <- aggregate(public_page$from_id, by=list(public_page$type), FUN=length)
The following output will be produced:
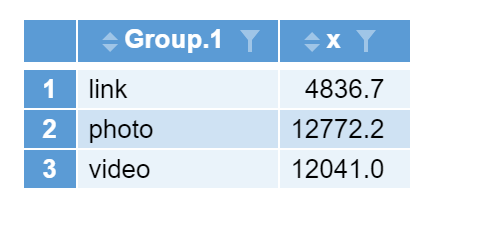
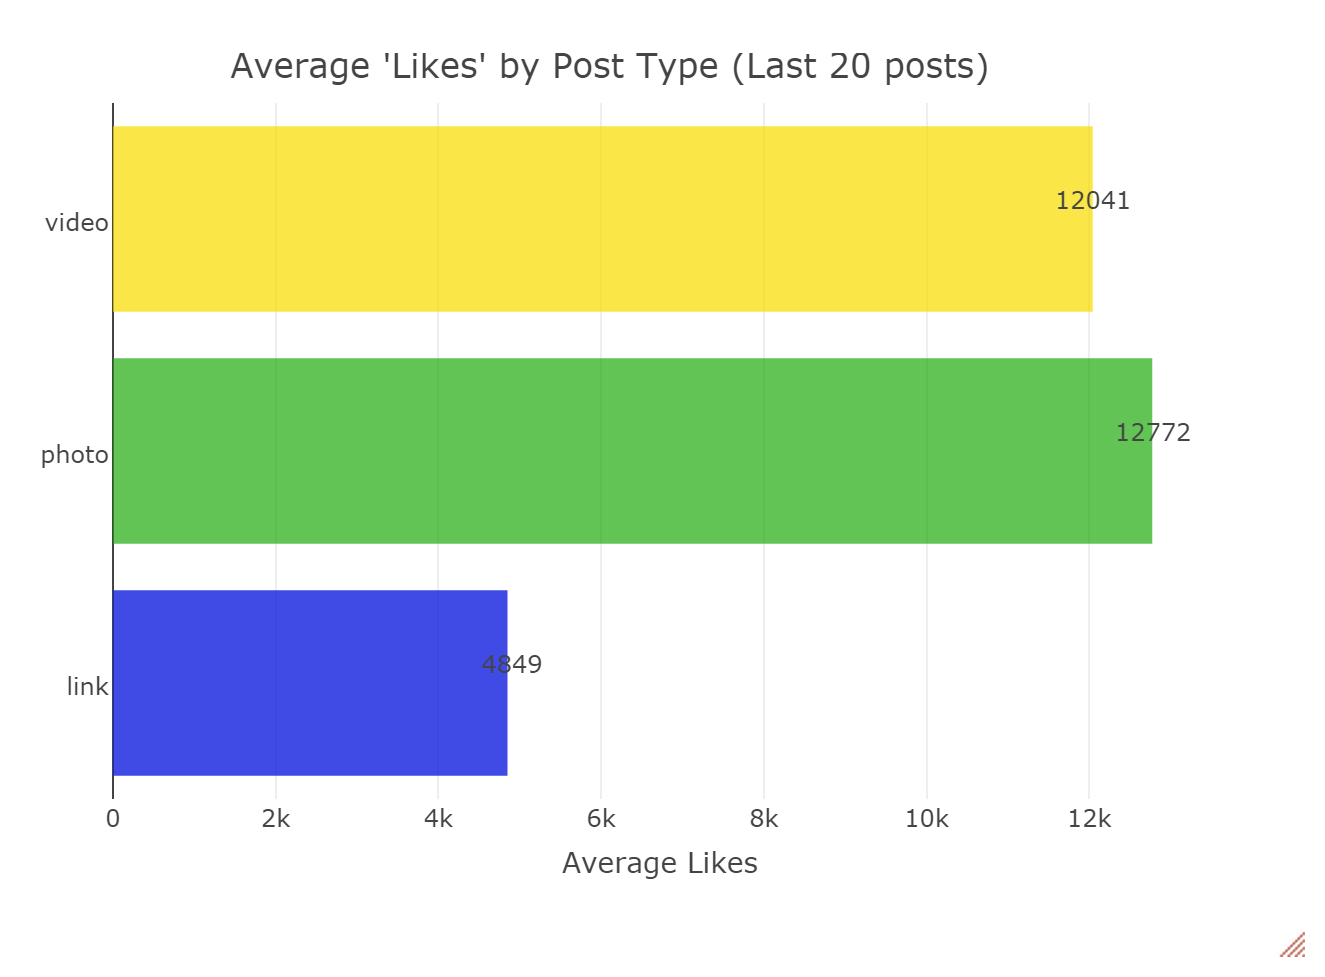
The following R code aggregates the average number of likes by post type:
aggdata.2 <- aggregate(public_page$likes_count, by=list(public_page$type), FUN=mean)
The following output will be produced:
Charting
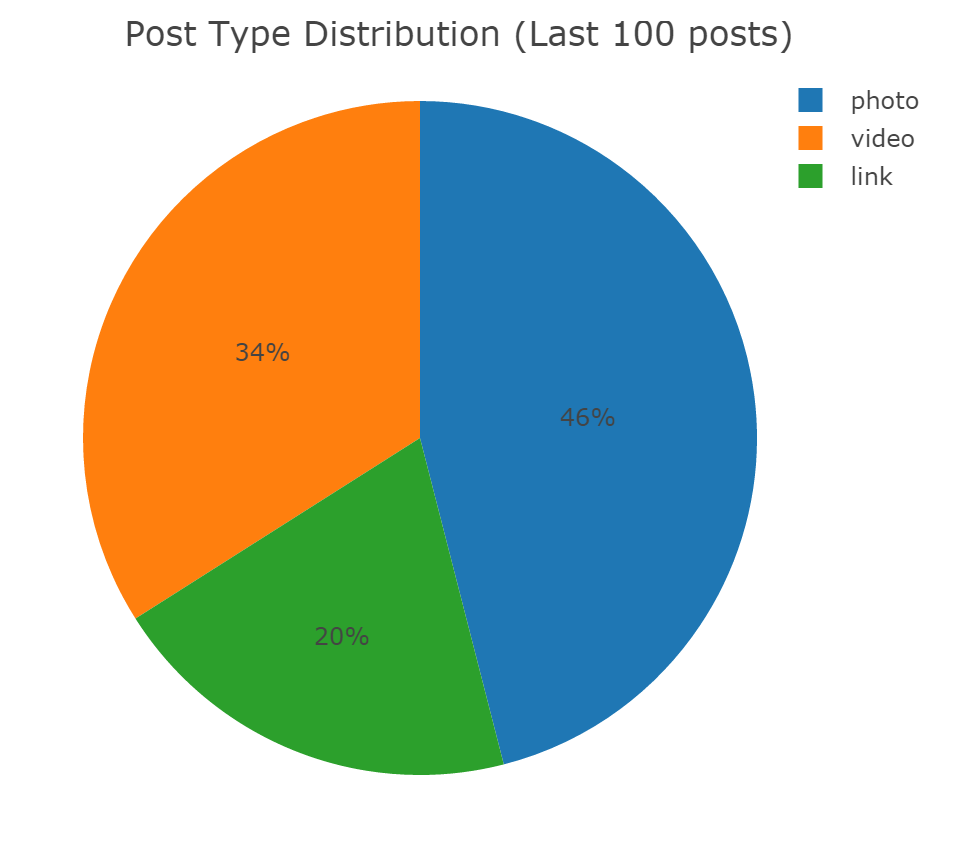
The aggregated data frames can be charted using an R charting package. Using the plotly package, a pie chart can be generated showing the distribution of post types:
library(plotly)

plot_ly(aggdata.1, labels = aggdata.1$Group.1, values = aggdata.1$x, type = "pie") %>%
  layout(title = 'Post Type Distribution (Last 100 posts)',
         xaxis = list(showgrid = FALSE, zeroline = FALSE, showticklabels = FALSE),
         yaxis = list(showgrid = FALSE, zeroline = FALSE, showticklabels = FALSE))
Again using the plotly package, the following example generates a bar chart showing the average number of likes by post type:
library(plotly)

plot_ly(
  y = aggdata.2$Group.1,
  x = aggdata.2$x,
  name = "Average 'Likes' by Post Type (last 20 posts)",
  type = "bar",
  orientation = "h",
  marker = list(color = c('rgba(15, 31, 222, 0.8)', 'rgba(20, 168, 0, 0.67)', 'rgba(250, 221, 0, 0.72)'))
)%>%

layout(title = "Average 'Likes' by Post Type (Last 20 posts)",
         xaxis = list(title = "Average Likes"),
         yaxis = list(title = ""),
         annotations = list(x = format(aggdata.2$x,digits=0), y = aggdata.2$Group.1, text = format(aggdata.2$x,digits=0),
                            xanchor = 'center', yanchor = 'bottom',
                            showarrow = FALSE))
API Limits
Rate Limits
Facebook imposes both Page and app rate limits. Rate limits can be tracked on your app dashboard. While not all API calls count against the rate limits, Page and application throttling will occur at the following limits:
- Application-level API rate limit: 200 calls/person/hour
- Page-level API rate limit: 4800 calls/person/24-hour period
More details regarding API rate limiting can be found on the Facebook Developer Network Rate Limiting page.
Displayr and Q (R Server) Limits
When making Facebook API calls from within Q or Displayr, the R server has a timeout limit of approximately 2 minutes. Under normal circumstances, Facebook will return approximately 1,000 to 1,500 records within this timeframe. The number of records that will be returned can vary depending on the type of API call being made (for example, searching a page versus querying insights data). Therefore, it is good practice to split larger data sets into multiple API calls so as to work within the R server timeout limits.
